
August 2026: Slow Is Not the Same as Soft
Miami, FL 33155 · Single-family homes · 5-year trend through August 2026
Balanced Market — 4.15 Months of SupplyThis Schenley Park Miami Fl 33155 market report covers August 2026, a month that makes the shape of this market unmistakable. Sales volume is down 14.9% year to date, while the average sale price has not moved. Here is what the data shows and what it means for your home in 33155.
What This Means for Sellers
- › Your equity is intact. The year-to-date average sale price is $1,149,571, up 1.1% over 2025.
- › Competition is thinner. 28 active listings versus 43 a year ago, with only 8 new listings in August.
- › Overpricing is the real risk. 84 listings have expired this year against 40 closings.
- › Day-one pricing decides it. The homes that closed in August had been listed an average of 228 days.
What This Means for Buyers
- › Conditions are balanced, not a bargain hunt. Months of supply is 4.15, down from 7.48 last August.
- › Selection is thinner. Active inventory is down 34.9% year over year.
- › Patience pays on stale listings. Sellers past 120 days on market are further along in reassessing their number.
- › Sellers here are not distressed. Expect negotiation on terms and timing more often than on price.
The Bottom Line
This is not a market correcting on price. It is a market correcting on participation. When a seller here does not get the number they want, they withdraw the listing rather than cut it, which is why values have held while volume has fallen.
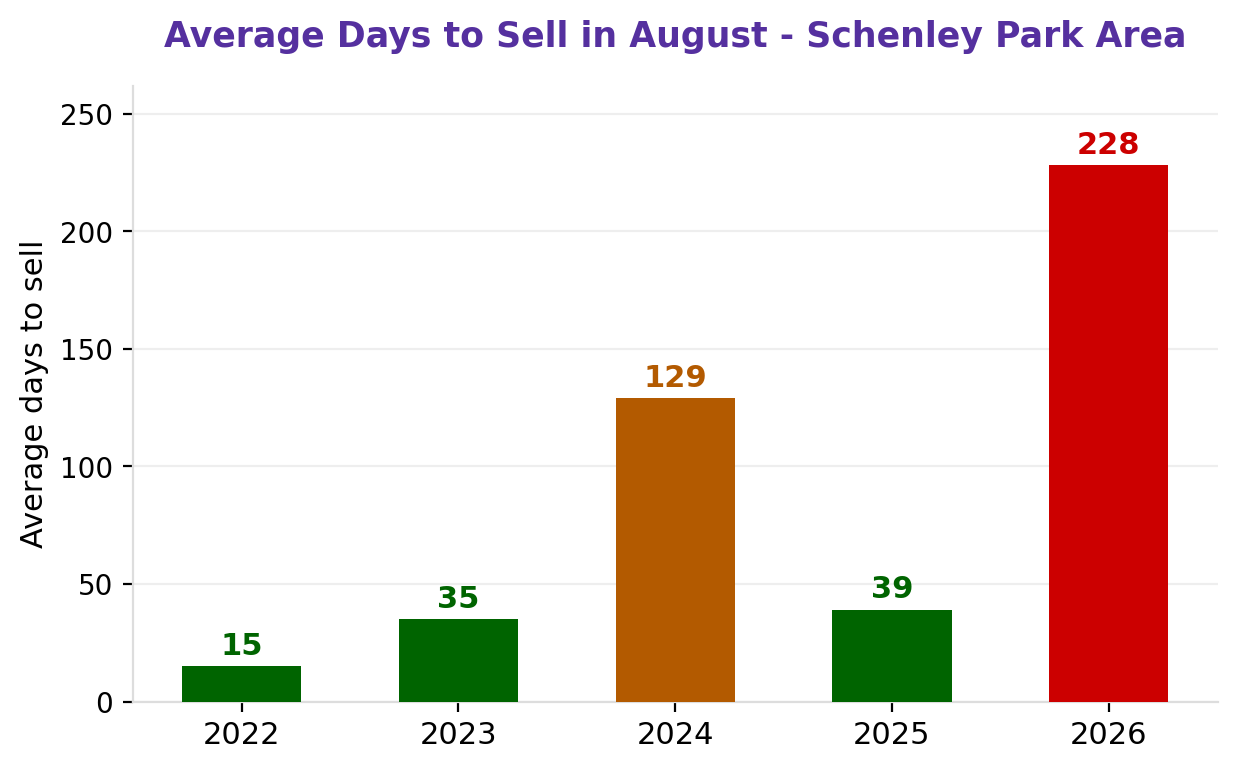
Average days to sell, August by year. The 228-day reading reflects only 6 sales and a few long-held listings that finally cleared; the 2026 year-to-date average is 95 days, up from 55 last year.
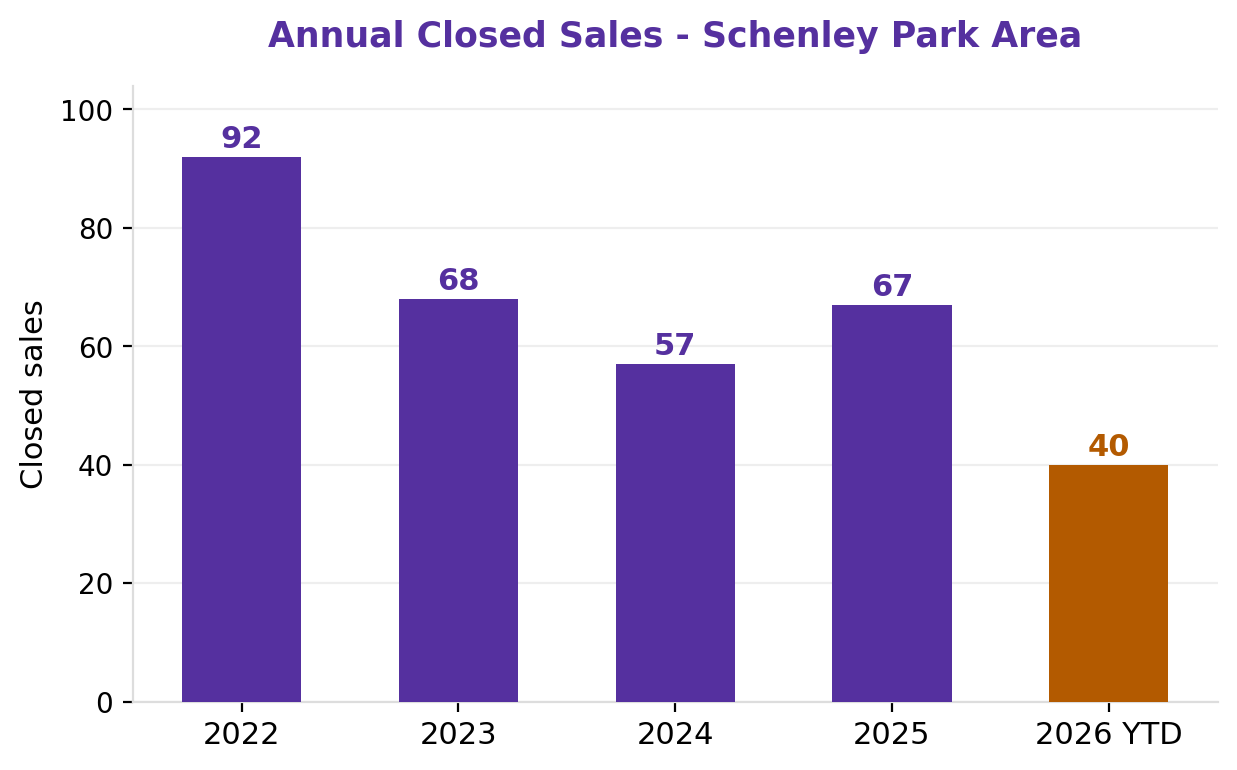
Annual closed sales in 33155. With 40 closings through August against 67 for all of 2025, this year is tracking below last year’s pace.
My Read on Why This Market Behaves the Way It Does
After more than 20 years working this area, here is how I explain the gap between falling sales and steady prices. Most owners in this pocket have held their homes for a long time and carry little or no mortgage debt. My estimate is that only around 20% of the total real estate value in this area is leveraged, which means almost nobody here is a forced seller.
When there is no debt pressure, there is no urgency. A seller can list at an aspirational number, wait six months, and simply take the home off the market if it does not sell. That is why inventory sits, why expired listings keep climbing, and why prices do not fall. The market is slow because sellers can afford to be patient, not because values are weakening.
What Is Your Schenley Park Home Worth in This Market?
Get a data-backed read on your home’s value in today’s Schenley Park market. No guessing, no averages.
Call or Text: 305-301-3290Real Estate Advisor | Coldwell Banker Realty
4000 Ponce de Leon Blvd 700, Coral Gables, FL 33146
305-301-3290 | Bere@BereHomes.com | www.BereHomes.com